Read a Visibility report
Visibility shows how often AI answers name your brand on a topic, as a range rather than a single number, with brands that cannot be told apart grouped into tiers and only real changes flagged.
Visibility shows how often AI answers name your brand on a topic, and how sure we are of it. Every score comes with the range it most likely sits in, brands that cannot be told apart share a tier, and a rise or a drop only counts once it is real.
The page answers three questions, top to bottom:
- Where do I stand? The headline, your score and the Visibility ranking.
- Have I really moved? The Visibility score chart, the GetMint Sentinel markers and Compare with…
- Who shapes the answers? Share of voice, Top domains and Top URL.
Why a range, not a single number
On Google, one search returns one list of links, and everyone sees the same result for weeks: you read a position. On ChatGPT, every run of a prompt returns a new answer, and your brand appears in some answers only: you read a share of answers, with a margin.
That margin is large on a single day. ChatGPT retrieves and writes a little differently every day, so one day's reading can be off by more than 20 points, while the real level moves slowly.
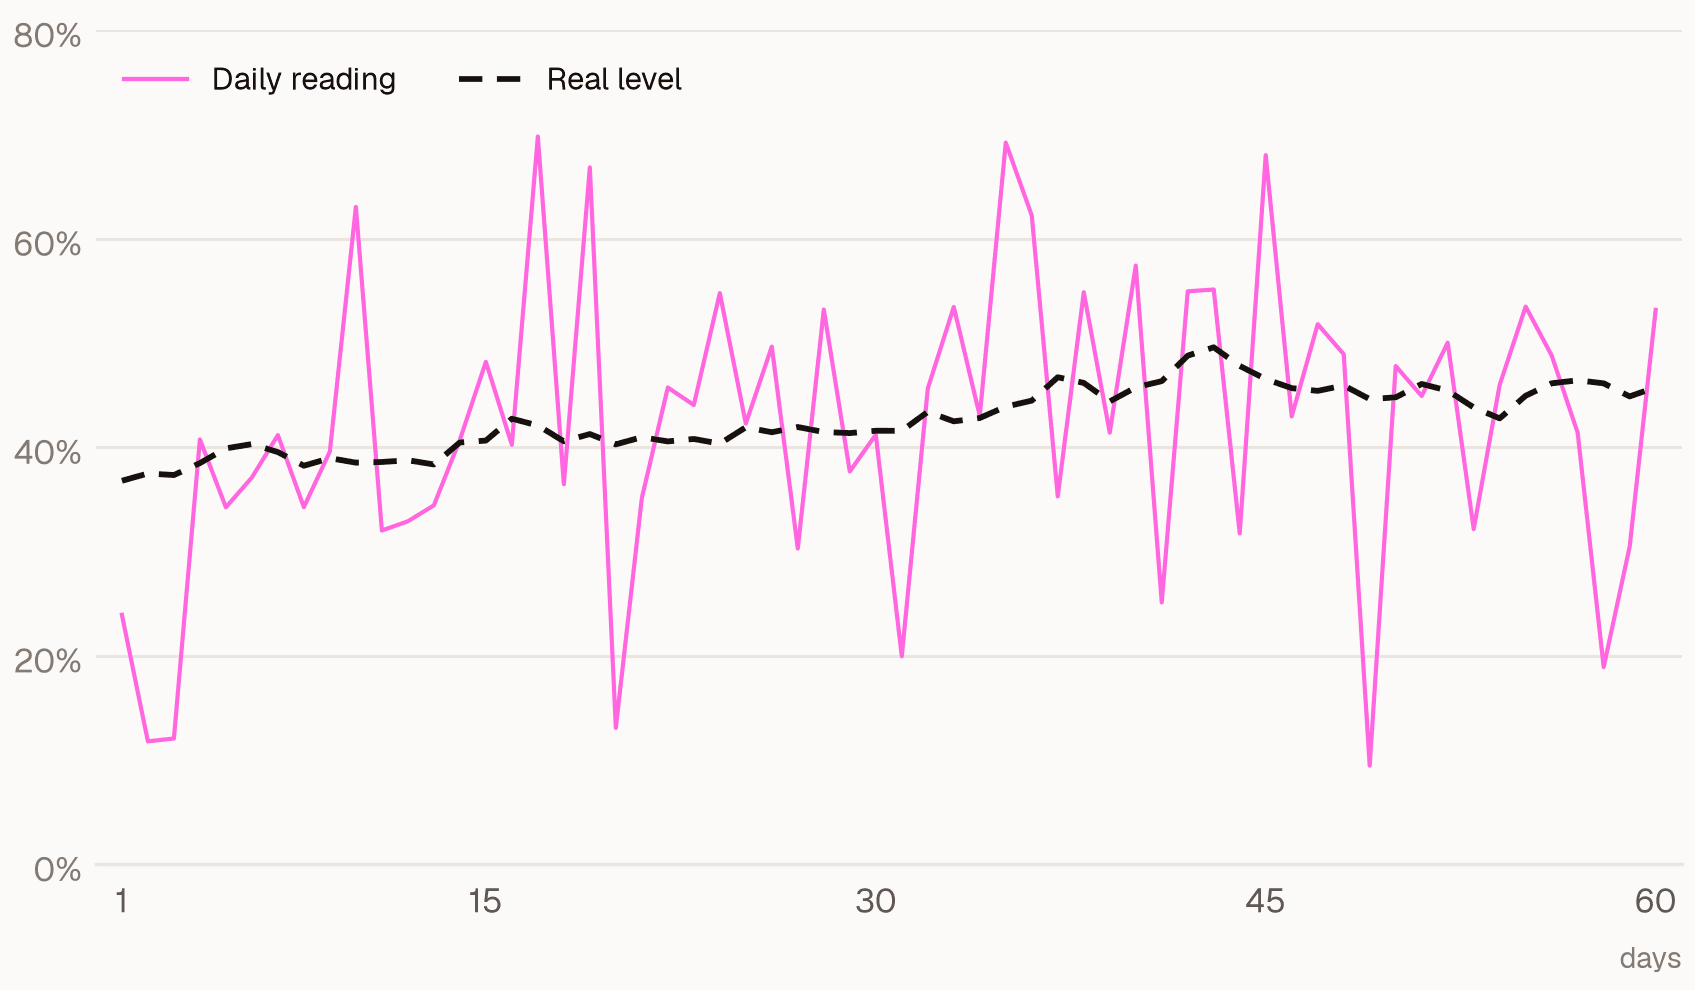
GetMint therefore pools the last 14 days of answers into one score, recalculated every day. Within two weeks the real level barely changes, so the daily readings can be combined. Beyond that, the level itself has moved and a longer window lags behind.
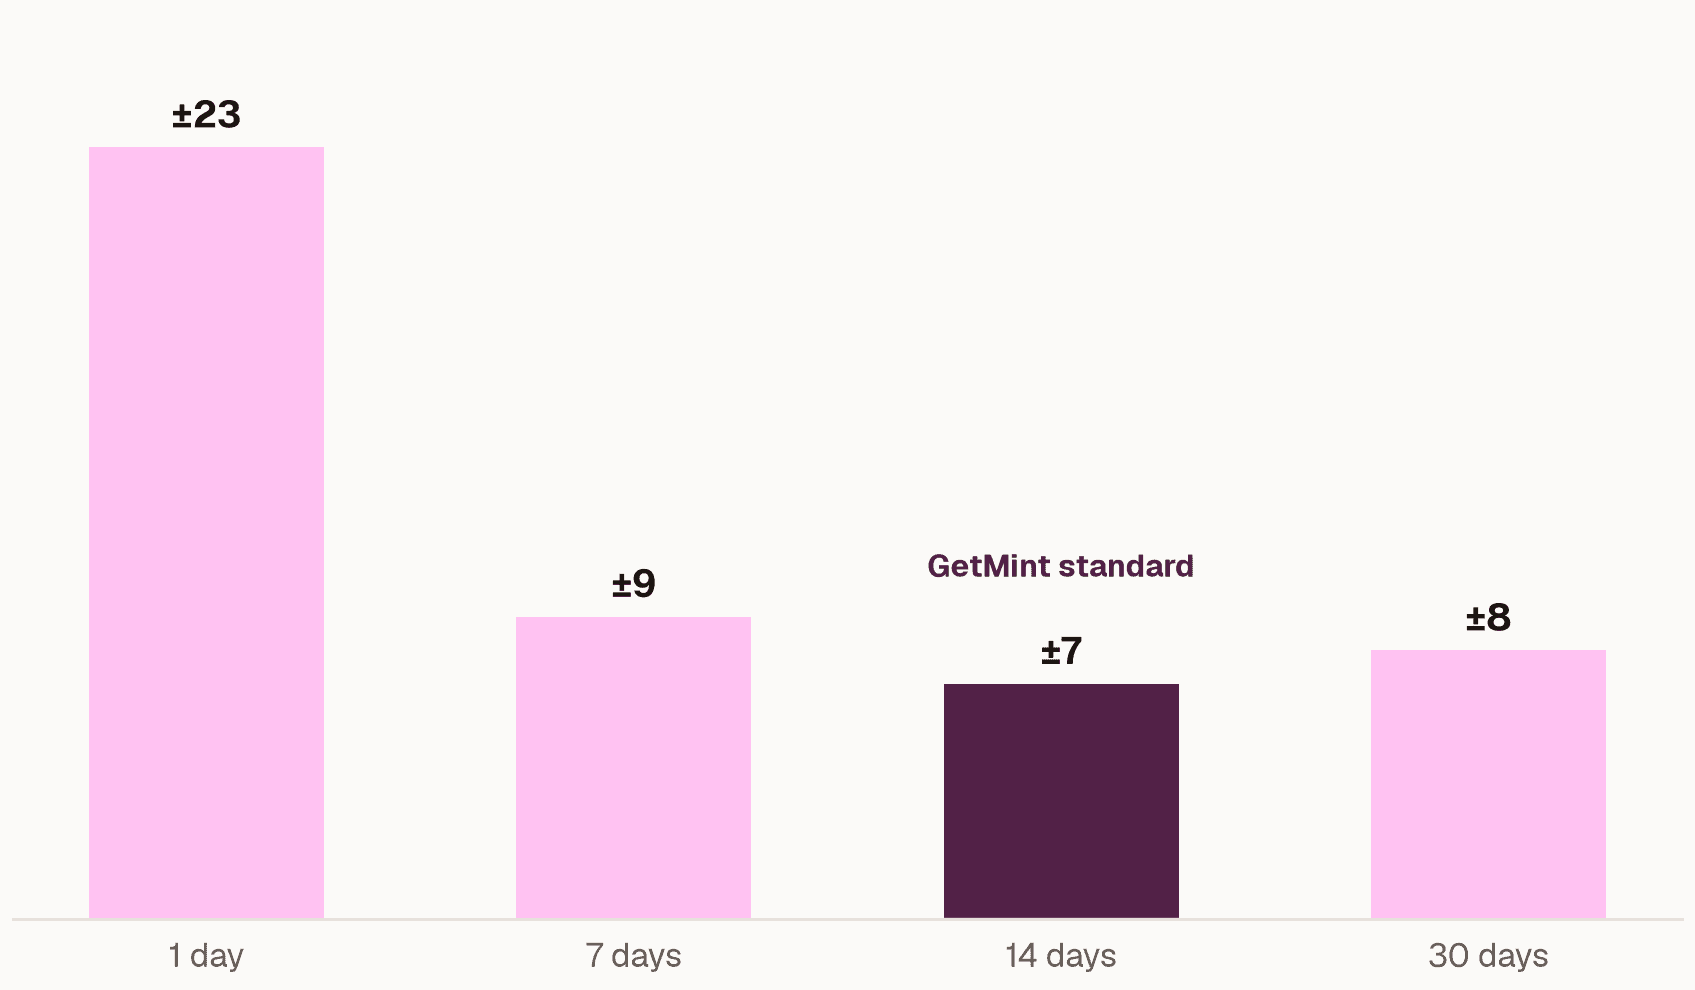
A score of 30% with a margin of ±7 means the true score lies between 23% and 37%. We are 95% sure it sits in that range.
What sets the width of your range
There is nothing to configure: the page reads the prompts and competitors already tracked on your topic. The width of the range depends on how much is measured.
| What you read | Margin over 14 days |
|---|---|
| One prompt | ±32 points |
| A tag of 8 prompts | ±11 points |
| A topic of 20 prompts | ±7 points |
| A topic of 30 prompts | ±6 points |
- ±10 or better: reliable, you can act on it.
- ±11 to ±15: read the trend only.
- Above ±15: too uncertain to act on.
Cover the topic across its intents and personas with 20 to 30 similar prompts. Beyond 30 the margin barely improves. Filtering on a single model or a single tag measures fewer answers, so the range gets wider.
Step 1: Read the headline and your score
The top of the page, on every tab, gives the answer in one line before any chart. On the left, a sentence places your brand among its tracked competitors. On the right, your Visibility score and its Range.
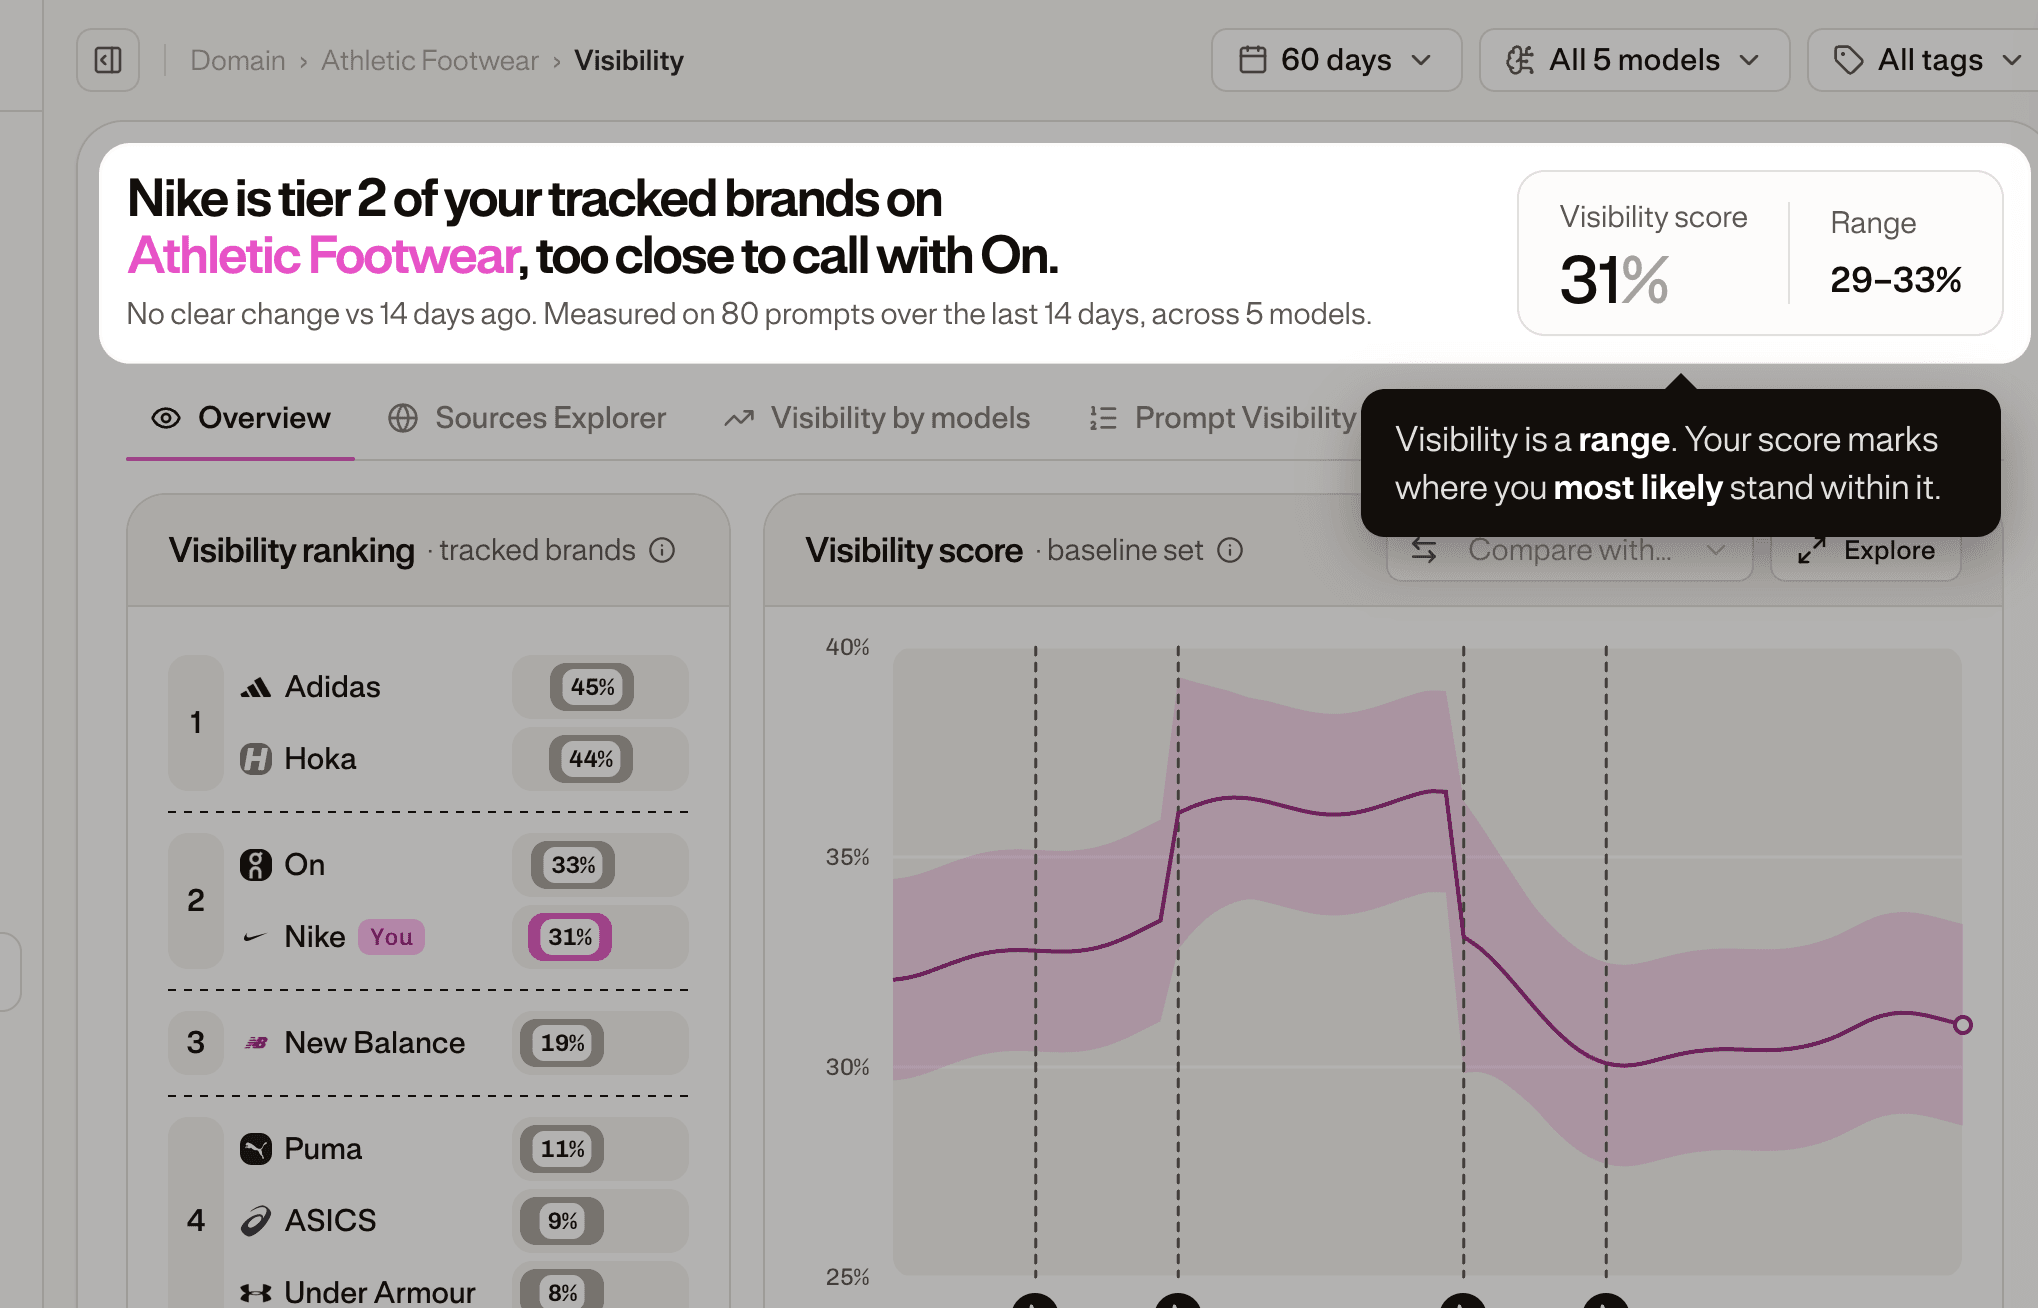
- The score is the most likely value. The range is what we can actually claim: read it first.
- "Too close to call with…" names the brands yours cannot be ranked against.
- "No clear change vs 14 days ago" means nothing moved beyond the margin.
Step 2: Read the Visibility ranking
The first card lists your tracked brands with their scores, grouped into numbered tiers separated by dashed lines. The faded tip of each bar is its margin of error; hover a brand to see its range.
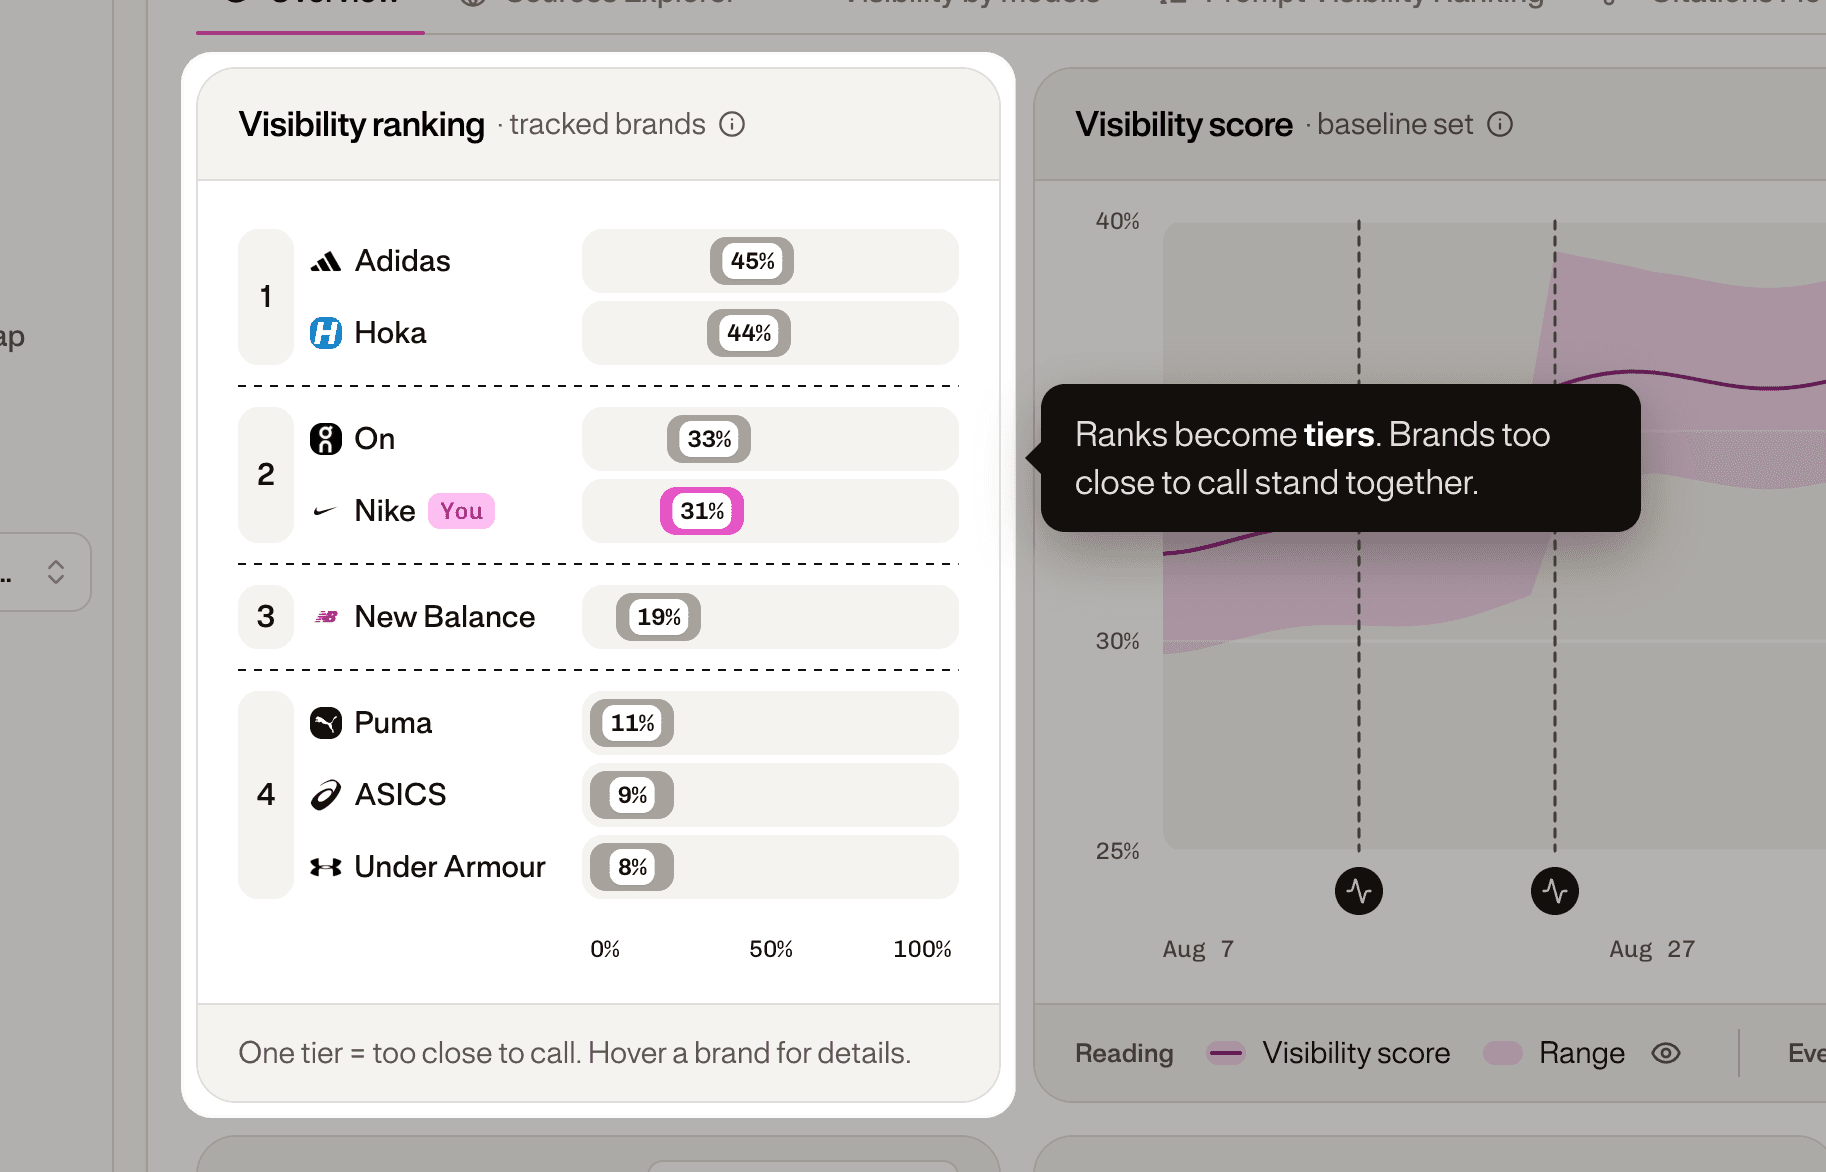
- One tier means too close to call. The brands in it stand together, whatever the order of their scores.
- Hiding a brand never renumbers the others.
It means one group of brands is clearly above. A brand at 33% and a brand at 31% with overlapping ranges share a tier: either could be ahead.
Step 3: Check whether you really moved
The Visibility score chart sits next to the ranking. The line is your score, 14 days of answers pooled; the pink band is its range.
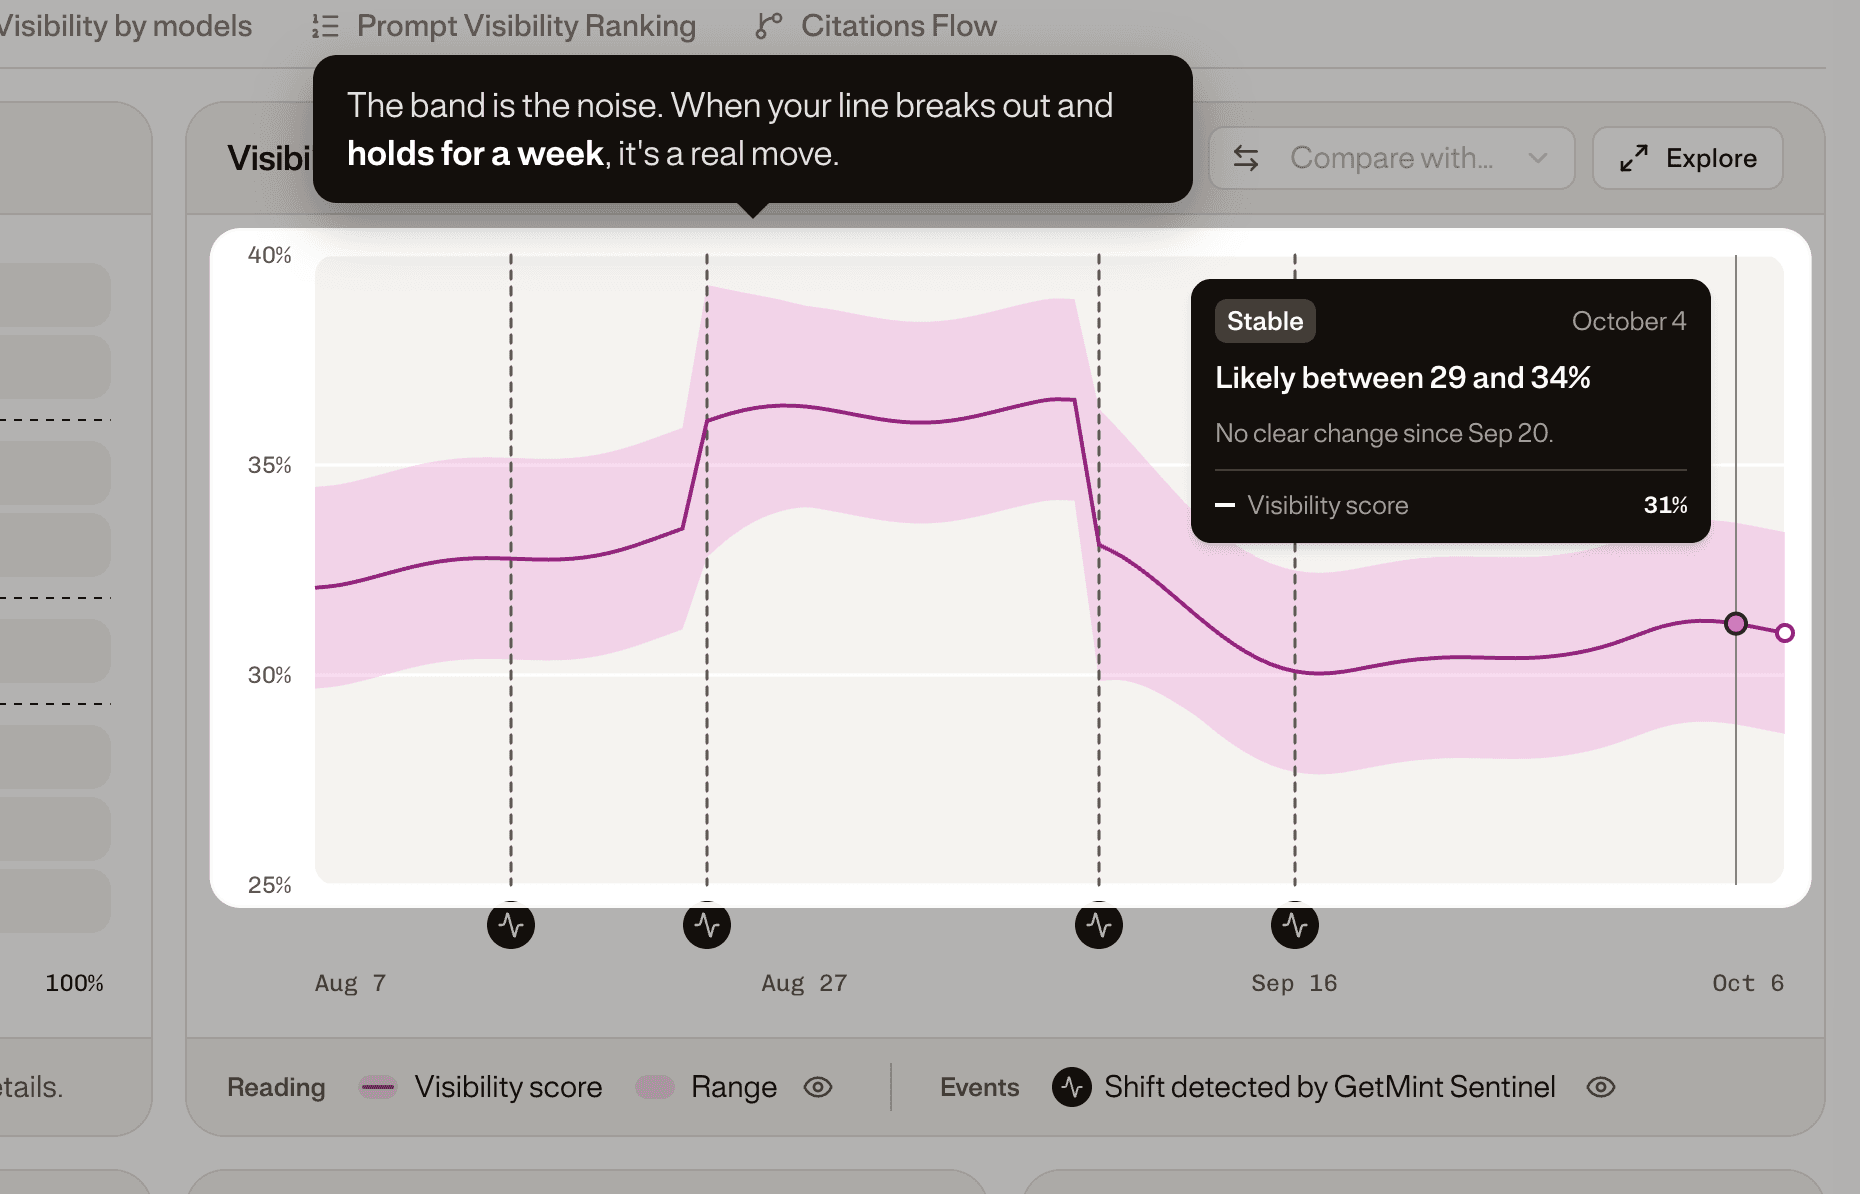
The band is the noise. When the line breaks out of it and holds for a week, that is a real move. Each point gives your status:
- Stable: nothing moved beyond the margin.
- Possible move: the line left the band, not for a week yet.
- Confirmed rise or Confirmed drop: it left the band and held.
A wide band means few prompts, or an engine that just changed.
GetMint Sentinel: the black markers
AI engines change without notice. On ChatGPT, GetMint detected 7 model updates in 89 days, and 6 of them were never announced. GetMint Sentinel checks every day whether all brands moved together, then dates the shift on the chart: a new model, an engine update, a GetMint update or an announcement. Hover a marker to see which one.
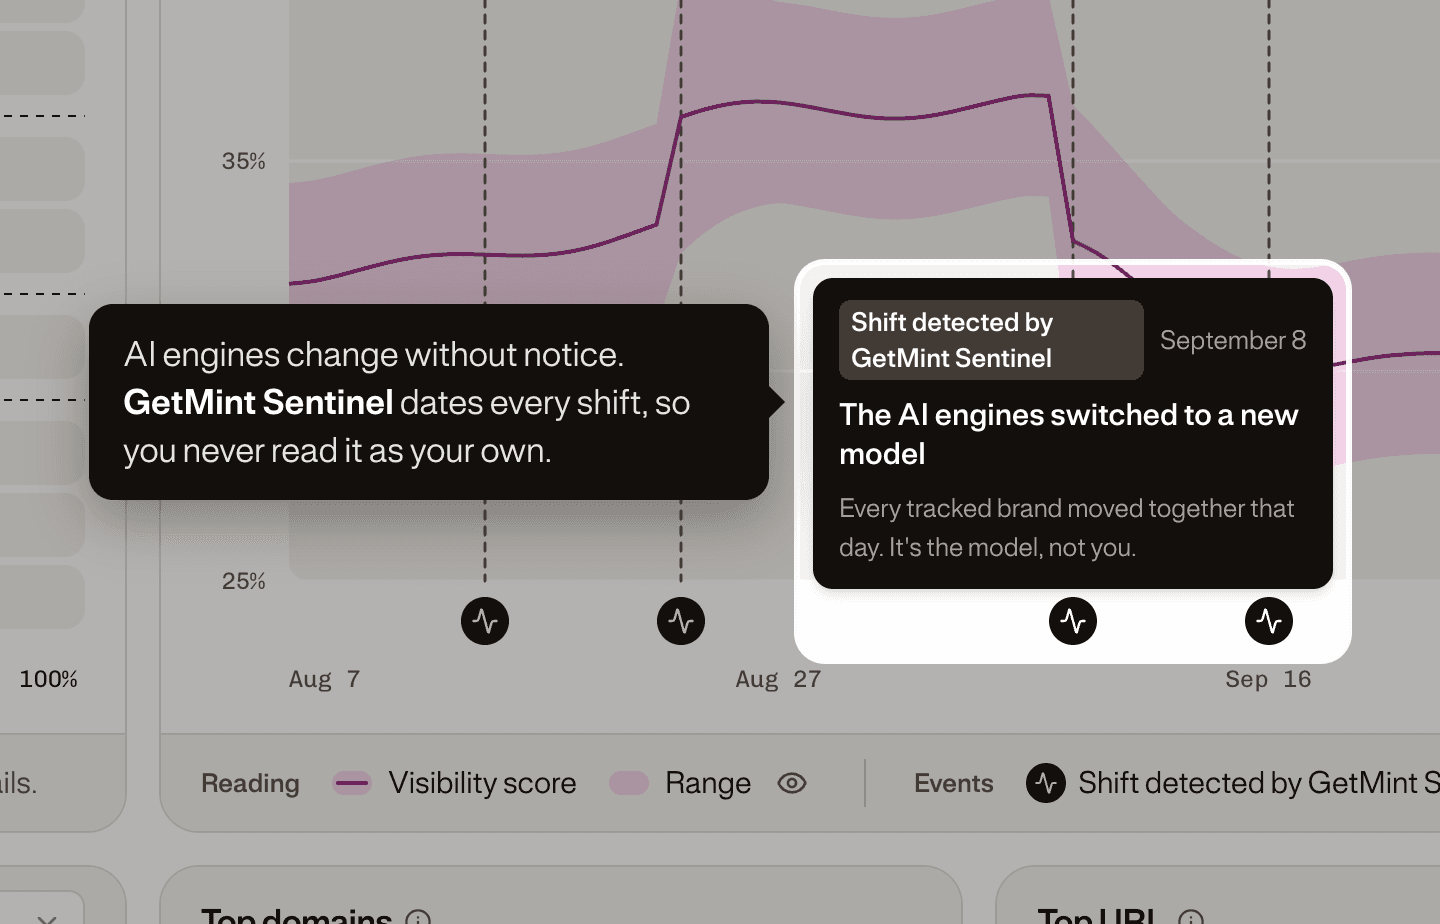
A model update moves every brand at once, so it says nothing about your brand. The 14-day window restarts from the last update, and an announcement can leave the answers unchanged: the marker says so.
Step 4: Compare with a competitor
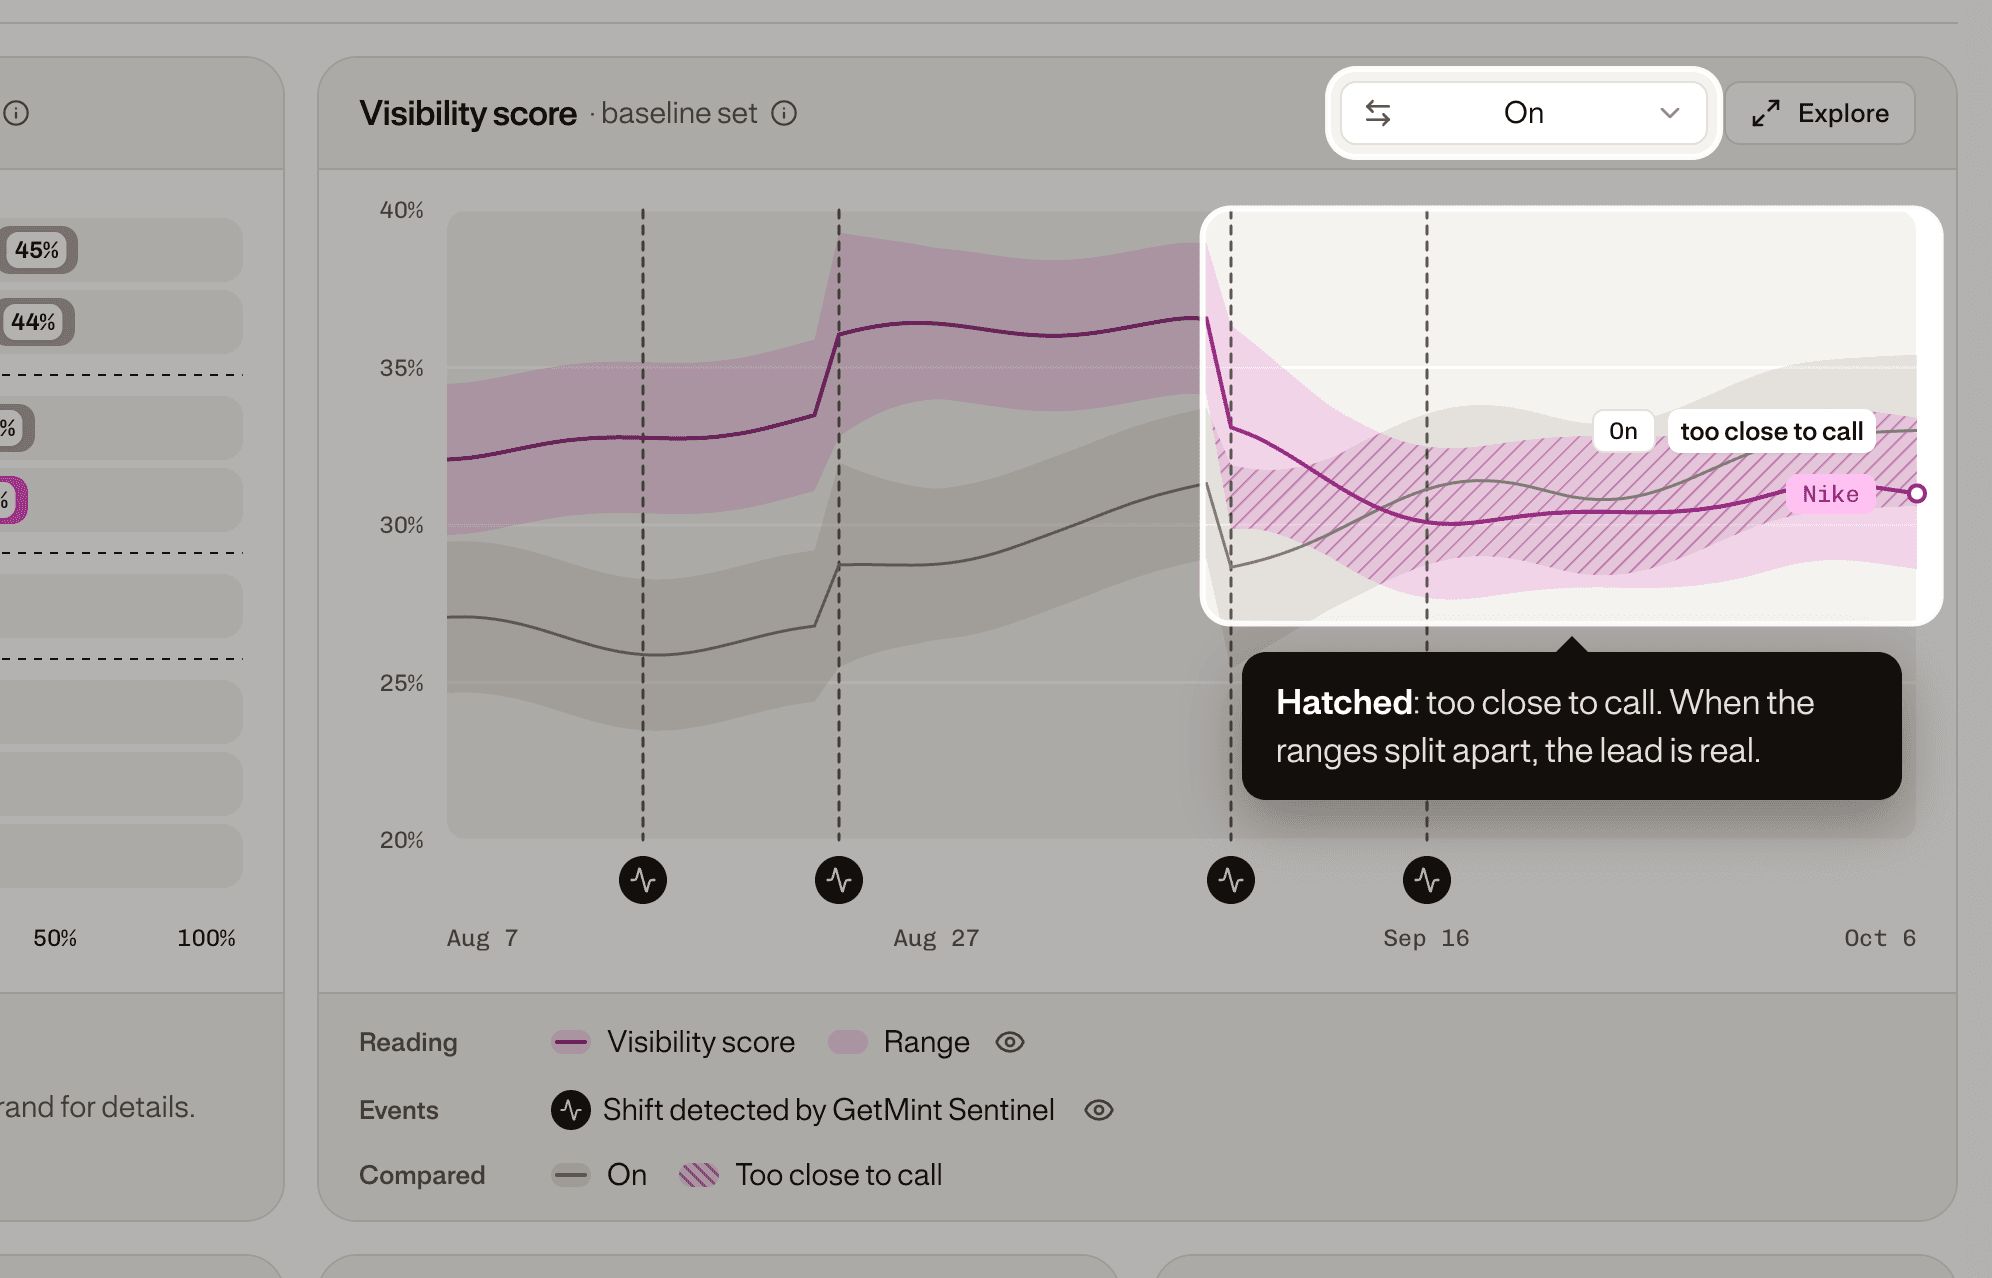
Click Compare with… on the Visibility score chart and pick a competitor: its line and range are drawn on the same chart. The hatched area is where the two ranges overlap, too close to call on those days. When the ranges split apart, the lead is real, and the chart says ahead of you or behind you.
Step 5: Read Share of voice
The Share of voice card shows each brand's share of all brand mentions in answers on the topic, with its margin, grouped by tier. It counts every brand the AI names, tracked or not: the whole market as the AI sees it.
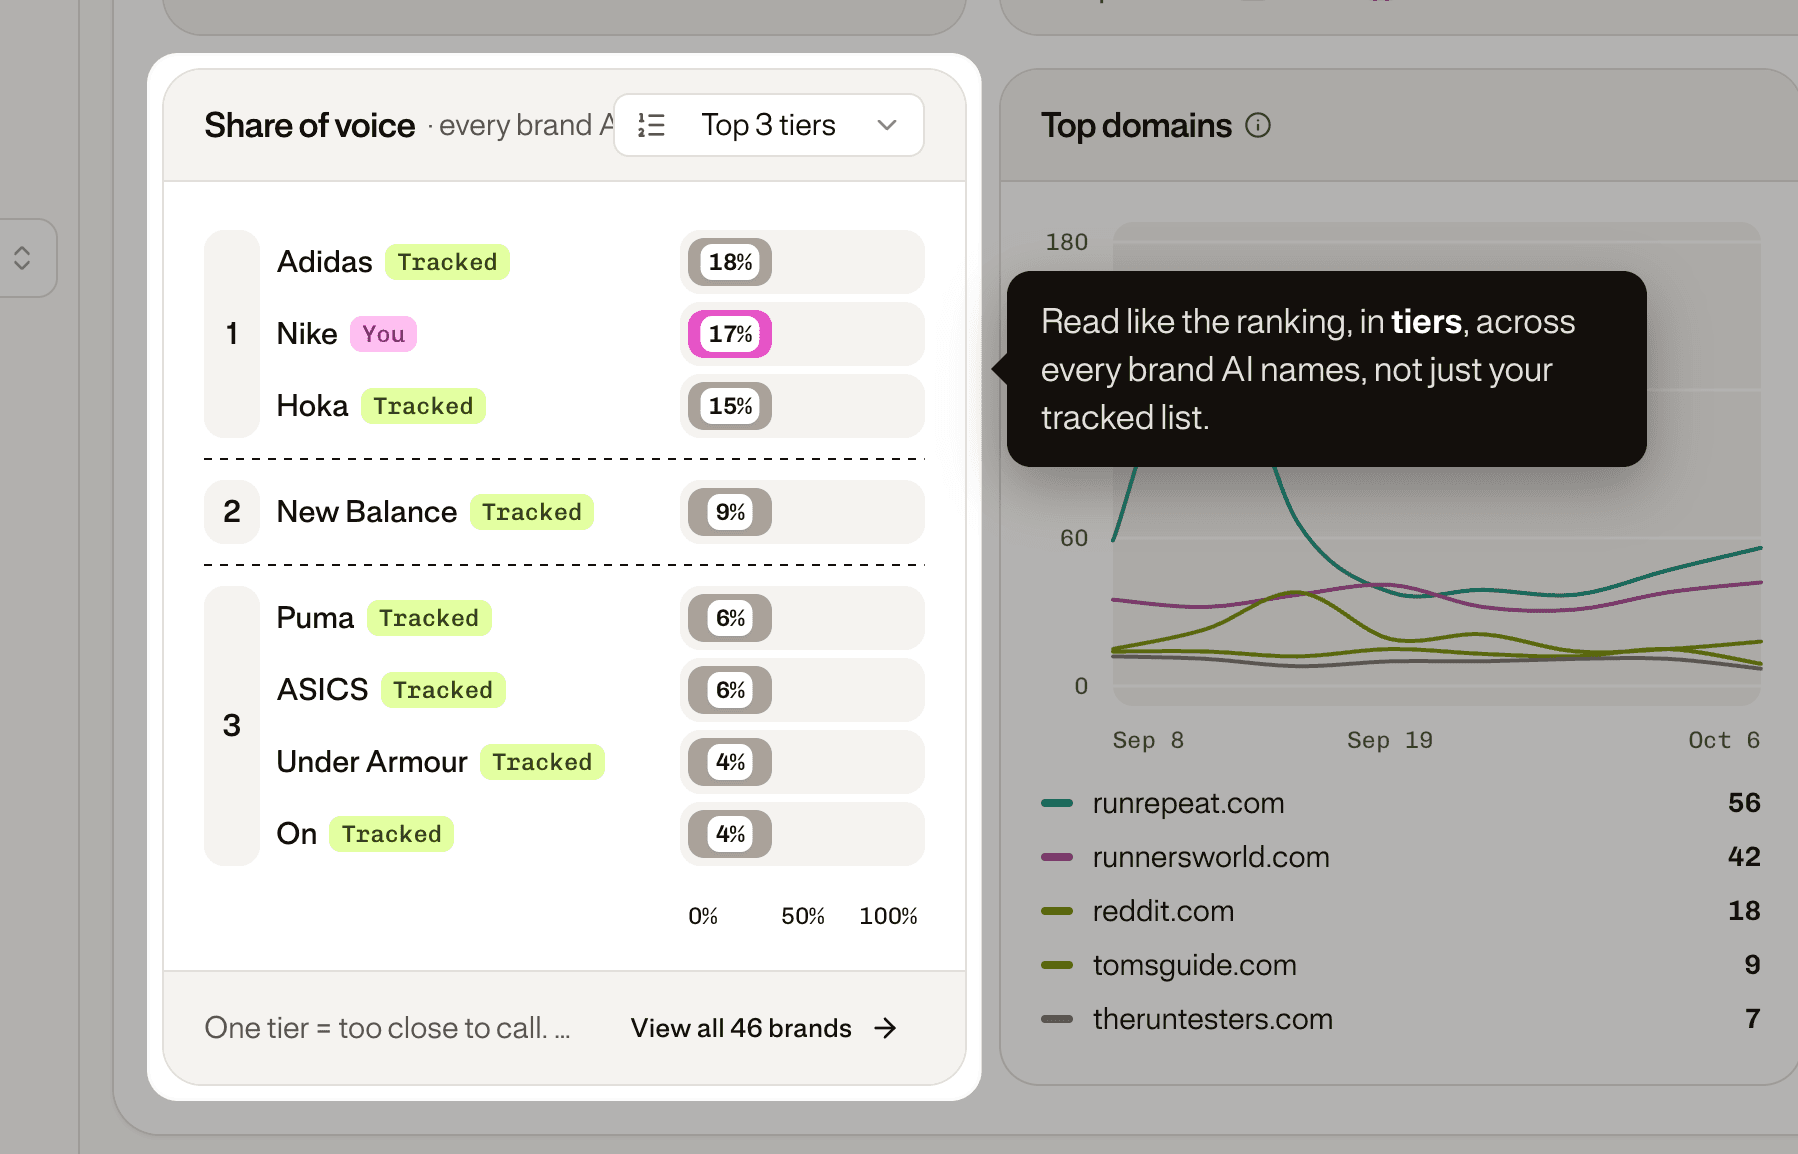
- The card shows the 10 brands with the highest share, plus your brand when it is not among them; a tier can hold more than one brand.
- View all brands opens a side panel listing every brand named, searchable, with a CSV export.
- Your tier here can differ from your tier in the Visibility ranking, because the brands counted are not the same.
| Metric | What it counts | Reads as |
|---|---|---|
| Visibility score | Whether your brand appears in an answer, among your tracked brands | % of answers naming you, with a range |
| Share of voice | All brand mentions across answers, every brand the AI names | Your share of all mentions, with a margin |
Step 6: Read Top domains and Top URL
Next to Share of voice, Top domains and Top URL show the five domains and the five pages AI answers cite most on the topic, over time, with their number of citations.
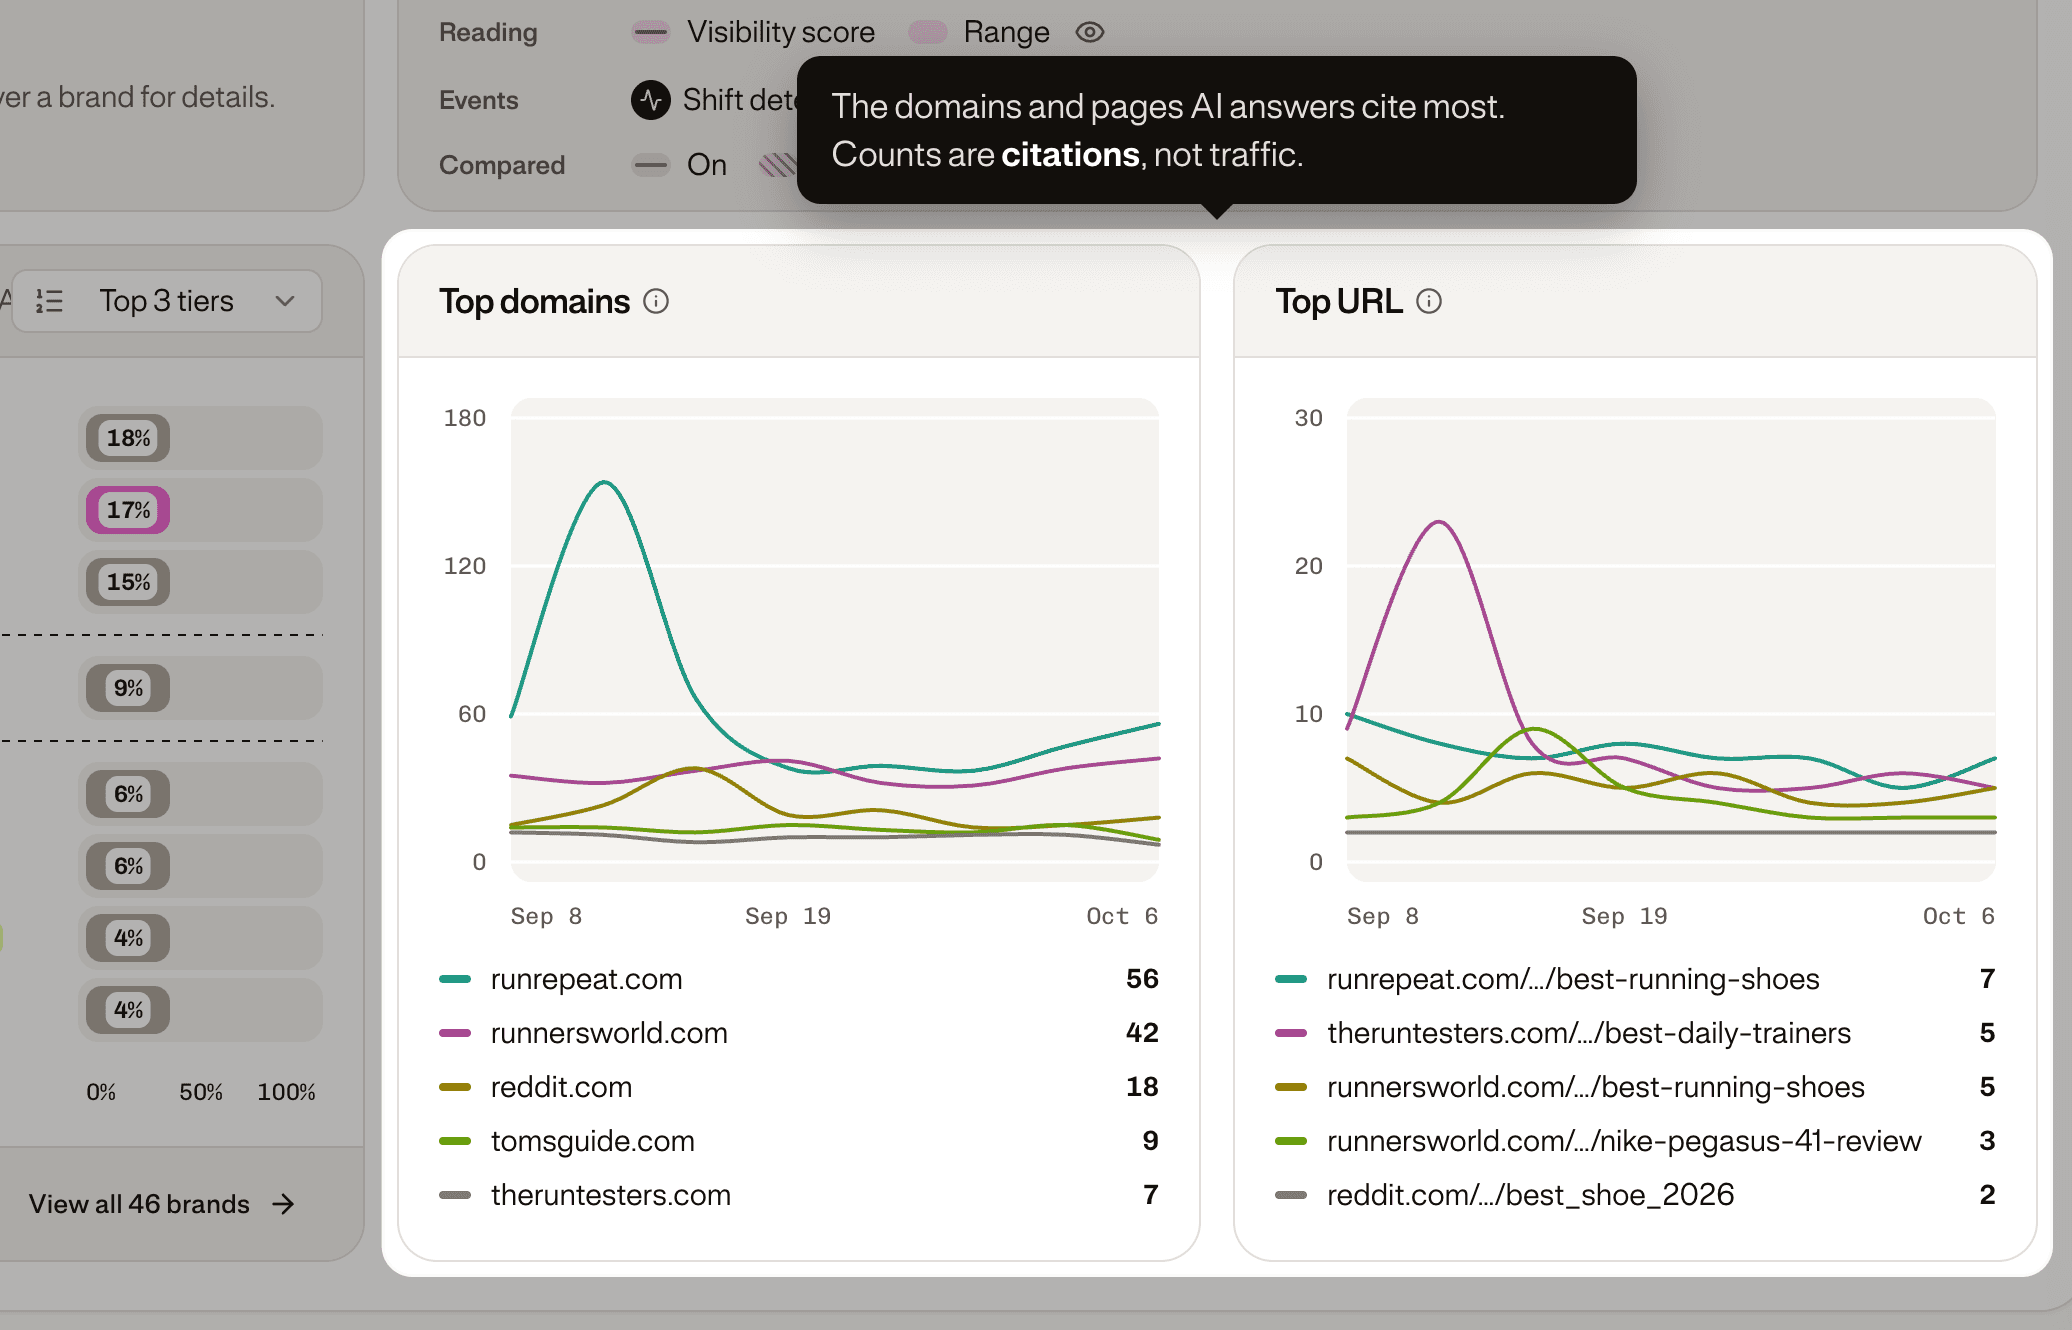
These counts are citations in AI answers, not traffic. A spike on one source often follows an article that just came out. The pages listed are concrete targets for content and outreach.
The other tabs
Sources Explorer lists every cited source, split into Core Sources, which answers keep coming back to day after day, and Other Sources, which pass through and are often gone within a day. Prioritise your actions on Core sources.
- Mention rate: the share of answers citing the source that also name your brand.
- Trend and Last cited show whether the source is rising and when it last appeared.
- Publish starts a publication request on a source; Export Results downloads the table.
Visibility by models gives one card per tracked brand, with its range on each AI model and its average across models, weighted by each model's share of answers. A single model has fewer answers, so its range is wider: when the ranges overlap, no model sets your brand apart. Export CSV downloads the scores. See Why are my results different from one AI model to another?
Good to know
- The days before this version show the former daily numbers as a 14-day average, for reference.
- There is no six-month trend. The trend compares with 14 days ago, or with the last model update if it is more recent: a month-old reading says nothing about today's level.
- Judging an action takes about two weeks after publication; before that, it is too early to tell.
- A question? Your GetMint Customer Success Manager can walk you through it.
Key takeaways
- 01Base decisions on tag and topic scores, never on a single prompt.
- 02Read every score on its 14-day trend.
- 03Ignore any change smaller than the margin: one tier means too close to call.
- 04Check the Sentinel before reacting to a drop.
- 05Wait two weeks before judging an action.
- 06Prioritise actions on Core sources.